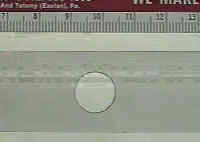
The following figures show a plastic specimen (made of PSM-1) with a central hole in it, and the central shank region of a dogbone-shaped sample cut from the same sheet of material. The sample will be used to calibrate the stress-optic coefficient of the material, i.e., calculate the value of C.
![]()
| Figure 1.
Plastic specimen with hole in center.
|
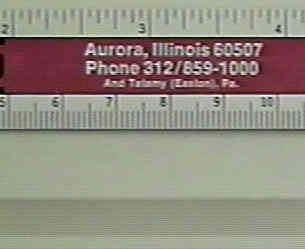
Figure 2.
Section of dogbone shaped calibration sample cut from
same sheet of material as specimen.
|
![]()
| Figure 3.
Side view of dogbone-shaped specimen
|
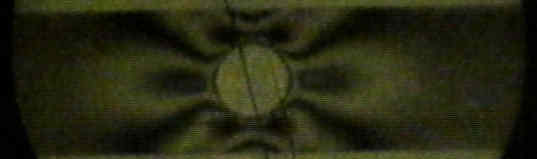
Figure 4.
Section of dogbone calibration sample when subjected to
loading that turns it dark.
Figure 5. Section of dogbone calibration sample when subjected to loading that turns it bright.
|
Note on Figures 4 and 5. The dogbone-shaped sample turned dark when the tensile force reading was 0, 24, 46, 68 lbs. From this, and the geometry of the sample being viewed, it is possible to determine the stress-optic coefficient C.
![]()
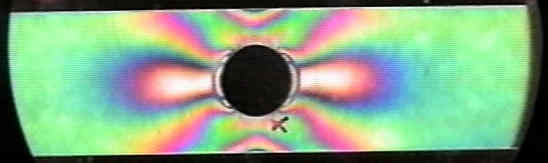
Figure 6. Picture of specimen under a tensile load resulting from an applied force of 59 lbs. and viewed with polychromatic light. Note location of handwritten x marked on the specimen.
![]()
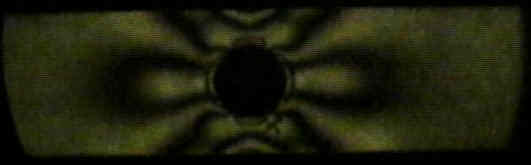
Figure 7. Same loading as in Figure 6, but this time the specimen is viewed with monochromatic light of wavelength 580 nm.
![]()
Figure 8. Same loading condition as in Figures 6 and 7, but now Tardy compensation has been applied by rotating the polarizer/analyzer pair 5.0 degrees to bring an isoclinic on top of the x mark, and then rotating the analyzer alone by 80.8 degrees to bring an isochromatic over the x mark. (Ignore the two long thin scratch marks. They are due to the fact that one of the quarter-wave plates is cracked.)
![]()
Question 1. Figures 1,2,3 allow the determination of geometric factors necessary to get the stress-optic coefficientC. Assume linearity and use the data values given with Figures 4 and 5 to calculate the numerical value of C. Note that sx - sy = CN/t or, in terms of the maximum shear stress, tmax = CN/(2t), where t is the specimen thickness. In terms of the uniaxial stress along the dogbone shank, there is only one stress component, so s = CN/t.
Question 2. What geometric factors are required to just determine C, and what additional geometry is required to change the applied stress from force units to stress units?
Question 3. Use the colors of Figure 6 to determine at least one fringe transition number.Note that away from the hole and the loading pins, it is reasonable to assume the stress is approximately linear and equivalent to what was obtained in the calibration data, taking into consideration that the dimensions of the cross-sectional area are not the same. Does the sequence of colors help you to determine which way the stress is increasing or decreasing?
Question 4. Now locate the fringe order on Figure 7 (monochromatic) that corresponds to the fringe selected in Figure 6. Can you now number the remaining fringes?
Question 5. What is an early estimate of the stress at the point marked with an x?
Question 6. Why are the quarter-wave plates not used to determine the direction of the shearing stress at x, and, assuming that the direction of applied load specifies the x-axis taken as positive to the right, what is the direction of the shearing stress?
Question 7. Explain how Tardy compensation works. If the analyzer is rotated 80.8 degrees clockwise, what is the fractional fringe order at x, and, assuming that the higher numbered fringe moved over the test point x, what is the total fringe order at x?
Question 8. Given an aluminum piece the same shape as the plastic specimen, but having four times the side area, twice the thickness, and subjected to 10 times the tensile force (do you want to work with force or stress units in determining the load factor?), what will be the direction and magnitude of the shearing stress at the point on the aluminum workpiece which corresponds to the point marked x on the plastic specimen?
![]()
Last Modified on April 20, 1997