| Phys 198 | February 12, 1997 |
Three basic facts about moire fringes obtained from linear grids are:
Basically, a moire fringe is a locus of points that have undergone the same displacement, some multiple of the master pitch, in a principal direction. Generally, in analyzing a moire pattern, the desired information is
The prior information usually known is the pitch p of the master (and specimen) grating, and the direction of the master grid lines. What can be determined by direct observation of the moire pattern is the relative fringe value N at any point, and the direction f of the moire fringes. (All angles are measured with respect to the direction of the master grid lines.) From this information e and q can be determined.
![]()

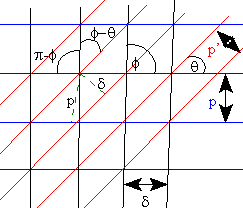
In the figure at the right, the blue horizontal lines represent the fringes of the master grating with spacing p. The red angled lines represent rotated and compressed specimen grating lines of pitch p', while the almost vertical black lines represent the moire pattern of pitch d. The moire lines are at an angle f which can easily be measured, taking the known direction of the master grating lines as the reference direction. The moire pitch d can also be measured from the figure. It is desired to determine q and p'. Although these values can easily be seen on the drawing, in cases where the pitch p' is very small, the lines may not be resolvable and q will not be immediately measurable.
Looking at the two green dashed lines in the figure, identifying the angles involved, and recalling that sin (A - B) = sinA cosB - sinB cosA, it is clear that

Now expressing q in term of the measurable d and f

If the grid pitches p and p' are very small and
the angle of rotation q is small, q = tan
q = p/d.
Looking again at the two green dashed lines in the drawing given above, it is clear that

which under the same assumptions as before reduces to

Remember that
 ,
,
so q
can be eliminated, giving

If q is small, and the first two terms
of the binomial expansion [(1 + x)n = 1 + nx + n(n-1)x2/2!
+ ... ] is used on the previous equation, the final result is

Now that p' is known, it is easy
to get the normal strain in the principal direction

The approach given above allows the determination of the normal strain along the principal direction (perpendicular to the lines of the master grating). What if it is desired to get the total strain over the whole image? If the master grid lines are aligned parallel to the y-axis, so that the sensitivity is in the x-direction, the image field is called the u-field because it shows displacements is the u (or x) direction. On the other hand, if the master grid lines and aligned parallel to the x-axis, then the displacement sensitivity is in the y-direction and the image field is called the v-field. Note that this generally means two different measurements with both the master and specimen gratings rotated 90 degrees between measurements. What is wanted is the normal strain along the x-axis exx, the normal strain along the y-axis eyy, and the shearing strain gxy. The definitions of these quantities are: exx = du/dx, eyy = dv/dy, gxy = du/dx + dv/dy. Since u = pN, du/dx = p(dN/dx), so the moire image gives the necessary data to get the desired results. One way to avoid making two separate measurements is to use a two-dimensional grid instead of an array of parallel lines, but interweaving of the two simultaneous patterns leads to difficult interpretation.
![]()
Use the two moire images given on the webpage for February 10 and see if you can carry out the calculations. For the first figure, what is the strain exx as measured by the specimen grating? For the second figure, what is the angle of rotation q of the specimen grating? Don't forget to compensate for any magnification introduced by the imaging process.
![]()
Last Modified on April 20, 1997