Apr 11, 2001 - Lab 5
Now that thresholding has been studied, it is time to apply it to the common
problem of particle counting. The example of a microfilter with
pores presented in class used the following image and showed how to get the
ratio of pores to background, the number of pores, the average size of pores,
etc. It is not necessary to include any of the microfilter material
in your report, but the picture is included here in case you would like to
review the procedures used in class.


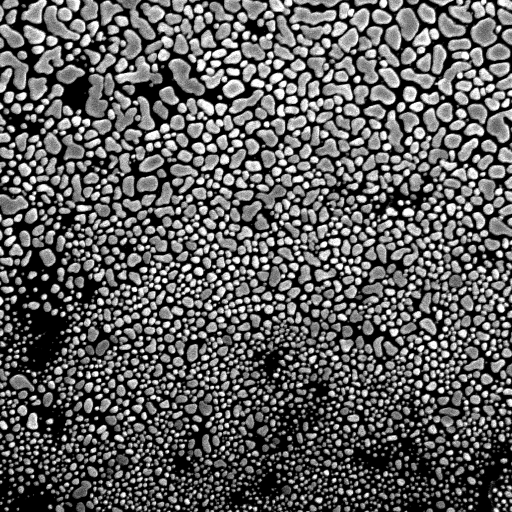
An image of some pebbles given below. What is the area of dark
background? Determine how many pebbles you think are present, get the average
size and standard deviation for the pebble set.
What is the average size of the pebbles for each horizontal third of the
picture (top, middle, and bottom)? Export the data for the ten largest
pebbles of the top third from Image/J into your report
document.


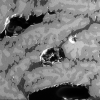
A second example, an SEM image of nickel, is more difficult because the
two lighter phases cannot be cleanly separated by thresholding
without some preprocessing. What is the relative area of each of the phases? If you want to express the amount of each phase as a percent,
you will have to subtract off the dark background.


Last modified on April 11, 2001
