Feb 21, 2001
The eye seems to be composed of rods and cones. Rods respond only to the
intensity of the light falling on them, and are more sensitive to low light
levels than are cones. The cones are of three different types and respond
differently to different wavelengths. What we perceive as color seems to depend
on characteristics of brightness, hue, and saturation. We
generally regard the basic colors as Red, Green, and Blue, and define other
colors as a mix of these three, the amount of each basic color being specified
by tristimulus values of X, Y, and Z, respectively. A color is then
specified by its trichromatic coefficients:
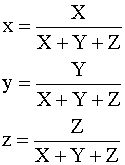
obviously, x + y + z = 1
Another approach to specifying color is to use the CIE chromaticity diagram
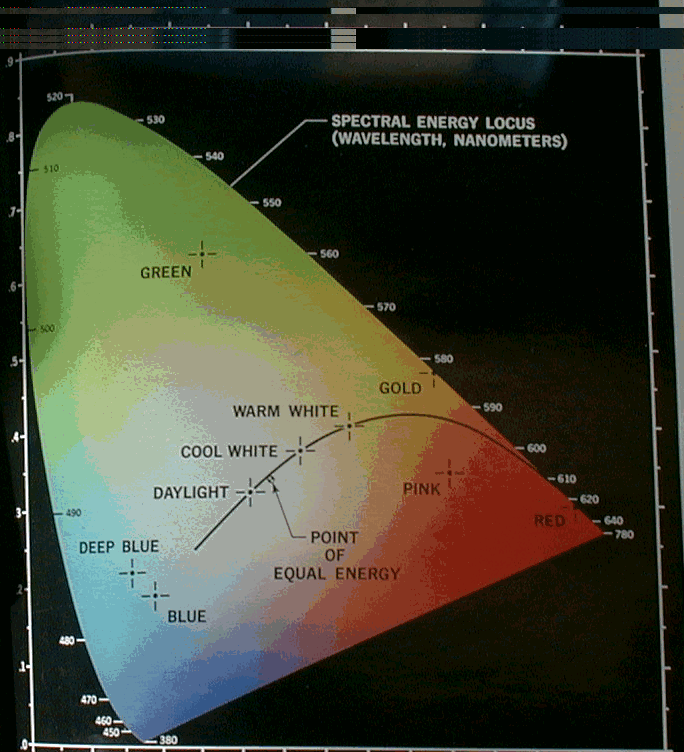
which gives color composition as a function of x (red) and y
(green), with the amount of z being determined from z = 1 - (x + y).
Points around the border of the diagram are considered fully saturated, while
the saturation goes to zero as one moves on a straight line from a boundary
point to the equal energy point which represents white. A straight line joining
any two points represents all the colors that are possible by combining those
two colors in varying amounts, while the triangle enclosing three non-collinear
points represents all the colors that can be produced by combinations of the
three colors represented by the triangle corners.
There are several models used to describe the tristimulus color scheme: RGB,
CMY(K), YIQ, HSI. Each model was derived for specific purposes and has certain
advantages over the others. Converting between the different models is generally
done by a relatively simple mapping:
RGB
In this model, the primary colors are red, green, and blue. It is an additive
model, in which colors are produced by adding components, with white having all
colors present and black being the absence of any color. This is the model used
for active displays such as television and computer screens. The RGB model is
usually represented by a unit cube with one corner located at the origin of a
three-dimensional color coordinate system, the axes being labeled R, G, B, and
having a range of values [0, 1]. The origin (0, 0, 0) is considered black and
the diagonally opposite corner (1, 1, 1) is called white. The line joining black
to white represents a gray scale and has equal components of R, G, B.
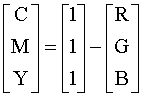
CMY
Cyan, magenta, and yellow are the secondary colors with respect to the
primary colors of red, green, and blue. However, in this subtractive model, they
are the primary colors and red, green, and blue, are the secondaries. In this
model, colors are formed by subtraction, where adding different pigments causes
various colors not to be reflected and thus not to be seen. Here, white is the
absence of colors, and black is the sum of all of them. This is generally the
model used for printing.
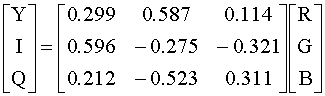
YIQ
This model was designed to separate chrominance from luminance. This was a
requirement in the early days of color television when black-and-white sets
still were expected to pick up and display what were originally color pictures.
The Y-channel contains luminance information (sufficient for black-and-white
television sets) while the I and Q channels (in-phase and in-quadrature) carried
the color information. A color television set would take these three channels,
Y, I, and Q, and map the information back to R, G, and B levels for display on a
screen.
HSI
In this model, as in the YIQ model, luminance or intensity (I) is decoupled
from the color information which is described by a Hue channel and a Saturation
channel. Hue and saturation of colors respond closely to the way humans perceive
color, and thus this model is suited for interactive manipulation of color
images where changes occur for each variable shift that correspond to what the
operator expects.
Conversions between Models
Conversion between RGB and HSI is somewhat more complicated:
Colors in HSI are defined with respect to normalized RGB values as
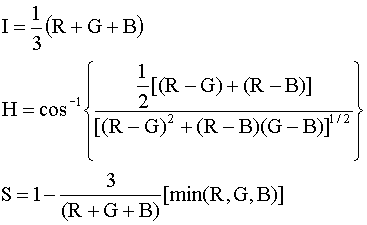
Even these equations need some correction:
·
H = (360o - H) if (B/I) > (G/I) and H is
normalized by H = H/360o
·
H is not defined if S = 0
·
S is undefined if I = 0
Pseudo-Color
Although the rods of the eye are sensitive to very low intensities, they have
very limited discrimination between gray levels. Generally, the eye cannot
distinguish more than about 50 gray levels in an image. Thus subtle detail can
easily be lost in looking at gray scale images. To enhance variations in gray
level and make them more obvious, gray scale images are frequently
pseudo-colored, where each gray scale (generally at least 256 levels for most
displays) are mapped to a color level through a LUT. The eye is extremely
sensitive to color and can distinguish thousands of color values in a picture.
Many different mapping schemes are used so that the variation in color, say
from blue to red, corresponds to human expectation of less to more. Greater
intensities then appear hotter.
Last modified on February 28, 2001